Recently a colleague asked for my help in understanding why he was seeing a specific security alert on a dashboard. The message said that his database instance was “exposed to a broad public IP range.” He disagreed with this assessment because it misrepresented the configuration context. While the database had a public IP, only one port was available, and it was behind a proxy. The access to this test instance was also restricted to “authorized” IP address ranges. I explained that this kind of information is what security practitioners like to know as they evaluate risk, but then thought, “is this a reasonable alert for a user or just more noise?” When did security dashboards become like the news, more information than we can reasonably take in, overloading our cognitive faculties and creating stress?
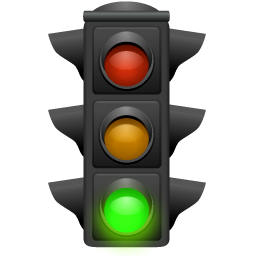
I have a complicated relationship with security dashboards. Though I understand different teams need a quick view of what they need to prioritize, findings are broadly categorized as high, medium, and low without much background. This approach can create confusion and disagreements between groups because those categories are generally aligned to the Vienna Convention on Road Signs and Signals. Green is good, red is bad, and yellow means caution. The problem is that a lot of findings end up red and yellow, with categorization dependent upon how well the security team has tuned alerts and your organizational risk tolerance. Most nuance is lost.
The other problem is that this data categorization isn’t only seen as a prioritization technique. It can communicate danger. As humans, we have learned to associate red on a dashboard with some level of threat. This might be why some people develop fanariphobia, a fear of traffic lights. Is this an intentional design choice? Historically, Protection Motivation Theory (PMT), which explains how humans are motivated to protect themselves when threatened, has been used as a standard technique within the domain of cybersecurity to justify the use of fear appeals. But what if this doesn’t work as well as we think it does? A recent academic paper reviewed literature in this space and found conflicting data on the value of fear appeals in promoting voluntary security behaviors. It often backfires, leading to a reduction in desired responses. What does work? The researchers identify Stewardship Theory as a more efficacious approach leading to improved security behaviors by employees. They define it as “a covenantal relationship between the individual and the organization” which “connects both employee and employer to work toward a common goal, characterized by moral commitment between employees and the organization.”
Am I suggesting you should throw your security dashboards away? No, but I think we can agree that they’re a limited view, which can exacerbate conflict between teams. Instead of being the end of a conversation, they should be the beginning, a dialog tool that encourages a collaborative discussion between teams about risk.


[…] Fear and Loathing in Security Dashboards. Do you “trust” the security dashboards and their many warnings and alerts? Michele […]